283% Gain in 1 Year - The Story of the 22-Year-Old Swing Trader

Interview by TraderLion
TraderLion is a trading education YouTube channel known for long-form interviews with elite retail traders and US investing competition champions. The channel focuses on setups, strategy, and the mindset behind consistent outperformance.
Martin Luk, a 22-year-old Hong Kong swing trader, walks through the system behind his 283% return in the 2024 US Investing Championship. He explains why he risks up to 5% per trade on tight stops, accepts a 23% win rate, and hunts entries with the highest potential R-multiple — prior-day highs, inside days, opening-range highs, and low-of-day reclaims. The interview includes live chart walkthroughs of his SMCI, GME, AMC, COIN, SOFI, Lemonade, and QBTS trades, plus the losses and rule-breaking that produced a 30% drawdown mid-year.
Books Mentioned
Key Insights
- Market & timeframe
- U.S. equities, swing trading and trend following. Holds positions one to three weeks; weekly charts set context, daily and intraday charts time entries.
- Setup & selection
- Fast-moving growth and momentum names from premarket, prior-day, and monthly leader scans. The ideal setup: a prior leg higher, then a tight consolidation after a large weekly base holding the weekly 21 EMA.
- Entry trigger
- A break of the prior day's high, especially after an inside day, or the opening-range high. Also intraday range highs, prior-week highs, and low-of-day reclaims when the stop is tighter.
- Stop
- At the low of the day, or the low of the five-minute entry candle if the day's low is more than 5% away. Stops stay under half the stock's average daily range and never more than about 5%, and are set before entry.
- Sizing
- Up to 5% of the portfolio per trade, scaled down in a losing streak and up with a profit cushion. A single position is capped at 35% (25–30% for small and micro caps); he rarely adds.
- Exits
- Trims 10–15% into strength at 3R or more, when the position exceeds 35%, when price is extended from the 9 EMA, or on euphoria. Otherwise trails the 9 EMA — widening to the 21 or 50 early in a trend — and sells into weakness.
- Shorts
- A downtrend with converging, declining EMAs. Enters a rejected rebound near resistance with the stop at the high of day, and exits faster than longs, selling into strength toward a logical support level.

Intro: 283% in one year at 22 — the highlights
TraderLion's cold open previews the episode's central themes: a 22-year-old Hong Kong swing trader who returned 283% in the 2024 US Investing Championship, the GME trade that nearly wiped him out, and the shift from trying to make back losses to focusing on disciplined decisions. Martin Luk explains that he cannot predict a trade's return but can always define and limit his risk, and that tight stops create a parabolic increase in risk multiples. Host Richard Moglen frames the interview around entries, exits, stop-loss management, and current short setups.
From HK$10,000 to a VCP obsession
Luk started trading in October 2020 with HK$10,000 — about US$1,300 — from a Hong Kong government cash payout, which was just enough to open a brokerage account. Lockdown gave him free time, and Hong Kong YouTube channels were saturated with VCP pattern videos, which led him to Mark Minervini, breakout setups, and systematic risk management. Studying finance and economics at university reinforced the interest, and the post-March-2020 US recovery made US markets the hot topic among his peers.
Tripling the account, then buying GME at the exact top
From October 2020 to January 2021, Luk randomly bought speculative growth names that kept going up and tripled his account in about three and a half months. When the January 2021 breadth decline hit, he suffered “death by a thousand cuts” and then bought GME at $501 premarket — near its $513 all-time high — after absorbing Reddit and Hong Kong forum hype. The stock fell 40–60% within two hours, and he lost roughly 50% of his account. He keeps the screenshots as a reminder never to buy the exact high of a parabolic move.
Two years underwater: books, podcasts, and Kullamägi
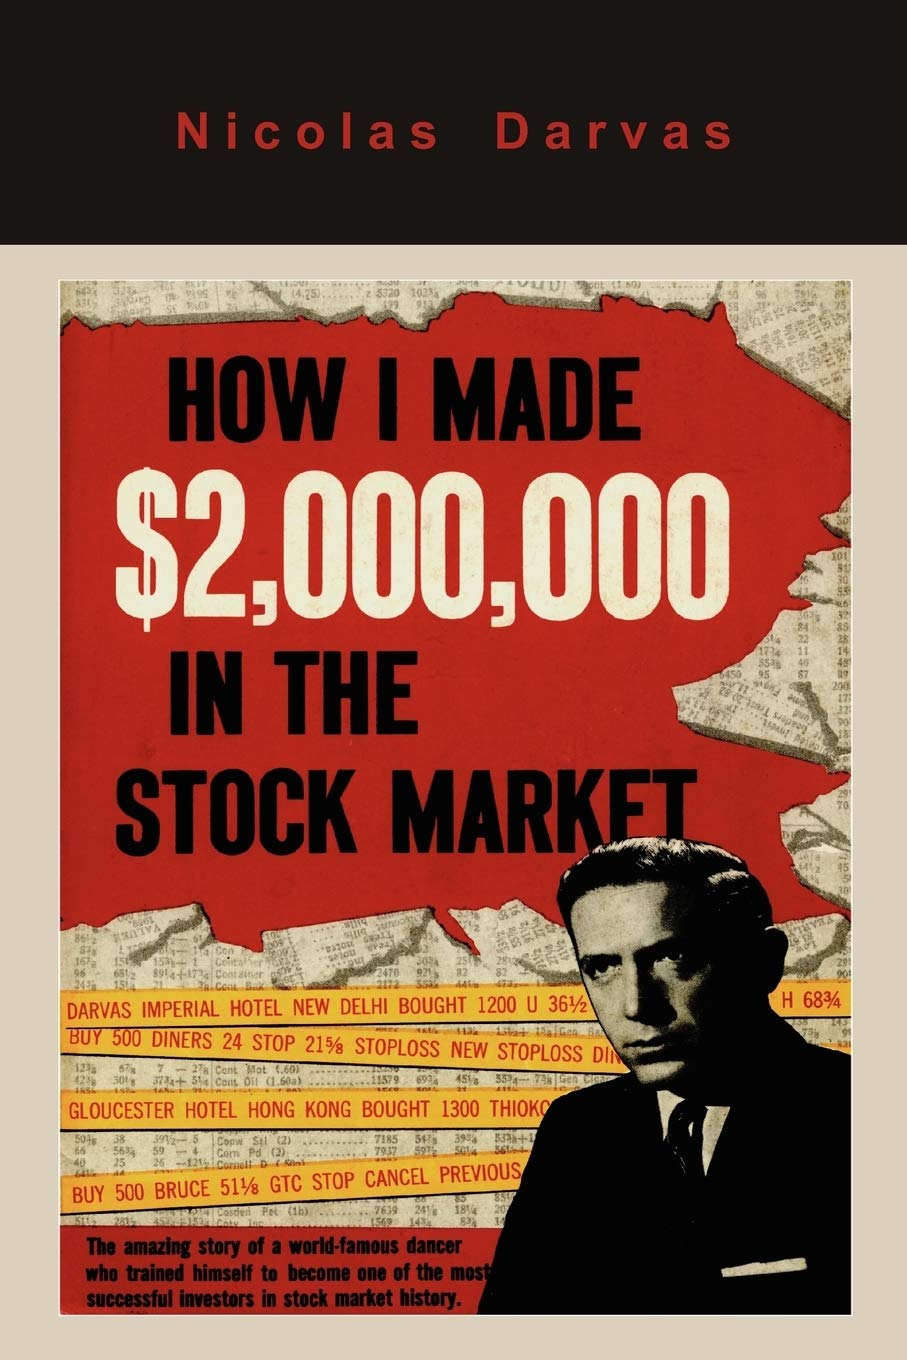
After January 2021, Luk endured a roughly 40–50% drawdown that lasted more than two years, largely because he failed to rotate from speculative growth stocks into the large caps that were working. He used the time to study: he took notes on TraderLion interviews, read trading books including Nicolas Darvas's How I Made $2,000,000 in the Stock Market, and watched Kristjan Kullamägi's livestream recordings. In 2022 — a bear market — he stayed mostly in cash, avoided catching falling knives, and scratched out a small single-digit positive year, with a natural-gas ETF (BOIL) trade as the biggest contribution.
Kullamägi's lesson: tighter stops, tight ranges, respect the stop
Luk credits Kullamägi with the biggest shift in his trading: moving from traditional breakout entries with 5–8% stops to aggressive entries from tight ranges with much tighter stops. Kullamägi emphasized that the best time to buy is when a stock breaks out of a tight range, and he drew trend lines differently from what Luk had learned. Above all, the lesson was to respect stops and manage risk first. Luk says those principles became the core of his own system.
The 2023 trade that ended a two-year drawdown
During a semester exchange in Germany in 2023, Luk caught a breakout trade that ran 100% in two weeks. It took his P&L back to all-time highs in percentage terms after a drawdown that had lasted since February 2021. More important than the money was the mental shift: he stopped trying to climb back to breakeven and started focusing on making the right decision and being disciplined. He calls it the turning point of his trading career.
Why he entered the USIC — and the 30% drawdown behind 340%
Luk joined the 2024 US Investing Championship in his final year of university, partly to squeeze the most out of his last period of free time and partly to force accountability under the stress of full-time trading. His official result was 283%, though he notes his actual 2024 return was 340% because he entered in February and January was excluded. The year was not smooth: from the May equity peak to the August–September low he gave back about 30%, which he attributes mostly to breaking his own rules, taking random trades, and being distracted by a summer bank internship.
Swing trading rules: 5% risk, 35% max position, 23% win rate
Luk describes himself as a swing trader and trend follower who holds working positions for one to three weeks. He risks up to 5% of the portfolio per trade, varies that down when he is struggling and up when he has a profit cushion, and caps any single position at 35% — or 25–30% for small and micro caps because of gap-down risk. He uses a tight-stop, low-win-rate approach: stops are limited to less than 50% of a stock's average daily range and never more than about 5%, which pushes him toward fast-moving stocks with ADRs above 5%. In 2024 he had 104 winners and 319 losers, a 23% win rate, a 15% average win, a 3% average loss, and an average five-day hold on winners; his tools are the 9, 21, and 50 EMAs, dollar volume, and anchored VWAP.
Tight stops and a low win rate make the math work
Luk's entry philosophy comes down to one question: can I manage risk here? He wants the lowest-risk entry point he can find, because he cannot predict a trade's return but can always set and limit the stop. Tightening a stop from 3% to 1.5% adds about 8 risk multiples on a 25% winner, 17 on a 50% winner, and 25 on a 75% winner — a parabolic relationship that makes tight stops and a low win rate mathematically attractive. He accepts that tighter stops lower the win rate; years of drawdown taught him to take losses without hesitation.
Big movers don't revisit the breakout-day low
Studying past winners such as Amazon, Adobe, First Solar, and Plug, Luk noticed a repeatable pattern: stocks that make big moves rarely revisit the low of the breakout day. Instead of gapping up 10% and down 15%, they grind higher along rising moving averages, which gives traders a logical place to set a tight stop. He cites Dan Zanger's line that winning horses don't back up at the starting block, and argues that if price takes out your stop, the entry was probably not the optimal buy point.
Entry triggers: prior-day highs, inside days, opening-range highs
Luk's default entry is a break of the prior day's high, especially when the day before was an inside day: the tightness often precedes a strong directional move. He also uses opening-range highs, intraday range highs, and prior-week highs, and he sets stops at the low of the day; if the distance between entry and the low of day exceeds 5%, he switches to the low of the five-minute entry candle. The goal is always the same — a precise, low-risk entry where the stop is obvious.
Opening-range and intraday-range entries, 1-min vs 5-min
Luk explains the mechanics of opening-range high entries: the first one-minute candle after the open sets the range, a break of its high is the entry, and the low of day is the stop. If the opening-range breakout fails but the setup still looks intact, he looks for a re-entry at an intraday range high, using tight ranges and the 9 EMA as guides, with the new low of day as the stop. He uses one-minute charts immediately after the open and switches to five-minute charts after the first five-minute candle forms, preferring five-minute for less noise and a higher success rate.
Sell rules: trim into strength, trail the 9 EMA
Luk combines selling into strength and selling into weakness. He trims roughly 10–15% of a position at a time when profit exceeds three risk multiples, when the position grows beyond 35% of the portfolio, when price is extended from the 9 EMA, or when he feels euphoric — which he treats as a top signal. For selling into weakness he uses trailing stops, mostly the 9 EMA, widening to the 21 or 50 EMA early in a trend to avoid shakeouts. He also trails below swing lows or breakout-bar lows when those levels make more sense.
Sell strength or weakness? It depends on the stage
Although Luk uses both exits, he leans more on selling into weakness. The balance changes with context: at the start of a move, when he is unsure whether breakouts will hold, he sells into strength more aggressively; in the middle of a trend he holds a larger portion for a bigger move. When the market is extended after months of gains or approaching prior highs, he trims earlier because the odds of rejection rise. His equity curve matters too — in a drawdown he sells into strength to reduce risk, while at all-time highs he trails more of the position to capture a larger trend.
SMCI: selling on a hunch cost 40R
Luk exited all of his SMCI position on a normal up day, telling himself the market was extended and due to reverse. He later realized he had not switched brokers as he originally remembered — he simply panicked and sold in the early part of a huge move, violating none of his sell rules but also following none of them. He estimates the mistake cost more than 40 risk multiples. It became one of the most painful lessons of the year.
SMCI: a mediocre entry saved by a six-month weekly base
Luk admits his SMCI entry was not his best: he bought after the breakout rather than at the prior-day-high trigger, partly because he was afraid of missing the move. What saved the trade was the weekly chart — a roughly six-month base that never violated the weekly 21 EMA and kept making higher lows and higher highs, followed by two tight weekly candles in January 2024. The weekly chart gives him the bigger picture and confidence to hold through daily noise; he prefers weekly context to support a daily entry.
Weekly bases are an edge, not a requirement — and why he rarely adds
Luk looks for a large weekly base because it adds confidence and an edge on breakouts, but he does not require one — some stocks make huge moves without a clean base. He also rarely adds to a position after the first entry: his tight stop already allows a large enough initial position, and adding after a 10–15% move would make the position too big. Most of his attempted adds have failed, so he treats the first entry as the position.
COIN: buying the low-of-day reclaim on a Bitcoin signal
Luk's COIN trade was not a conventional breakout. He bought near the low of the day as price tried to reclaim it, because Bitcoin had formed an inside day and was breaking prior-day highs; he expected COIN to follow. Waiting for COIN's own prior-day-high breakout would have made the stop too wide, so he used the low of day and an anchored VWAP break to define risk. He later panic-sold instead of following his sell rules, then watched COIN set up another breakout without him — a reminder that even a good entry can be wasted by poor execution.
GME: 54R by selling into a parabolic move
In May 2024, Luk took his biggest winning trade on GME. He entered on a prior-minute-bar high at $263 with a stop at $254.70 — about a 3% risk — because a stop at the low of day would have been too wide. He trimmed half at 12R and sold the rest near the exact highs as the stock went parabolic, remembering his 2021 mistake of buying the top of a similar move. Resistance from prior weekly levels and the parabolic extension told him the risk-reward of holding had deteriorated; the trade produced about 54 risk multiples.
AMC: stopped out, re-entered on an inside-day breakout
Luk bought AMC at the five-minute opening-range high and was stopped out when the breakout candle's low failed. He stayed with the idea, waited for the stock to form a tight range near the 21 EMA on the five-minute chart, and re-entered on an inside-day breakout. As price took out the high of day he raised the stop to the breakout candle's low — about 3.2% risk — and rode the position for roughly 170% before selling half premarket into strength near the declining monthly 9 EMA and 2020–21 swing lows.
SOFI: a textbook breakout, trimmed at 6R
SOFI was a cleaner, more traditional breakout than COIN or SMCI: after a move from $7 to $11–12, it pulled back for three days and consolidated near the 9 EMA, then opened in the upper part of the prior candle and took out the prior day's high. Luk entered there, set his stop at the low of day, trimmed a portion at six risk multiples, and closed the rest when price posted below the 9 EMA and growth names started breaking down in December. He had planned to trail on the 23 EMA but lost conviction in the broader market.
COIN election gap: trading an EP off headlines, not fundamentals
Luk traded COIN's post-election gap as an EP without examining fundamentals — he only reads headlines to understand why a stock is gapping, then focuses on the chart. COIN gapped more than 10% premarket near prior swing highs; he entered around the opening-range high as it cleared the swing highs and kept risk under 3%. He trimmed at seven risk multiples and closed the rest when COIN closed on the 9 EMA, as December breakouts began failing.
Lemonade: a high-tight flag sold into strength on volume
Lemonade had run 80–90% in two weeks and formed a tight range with repeated inside days. Luk entered on a break of the prior day's high with about a 3% stop and trimmed at eight risk multiples, then sold the rest into strength. The deciding signal was volume: by midday, dollar volume had already exceeded 50% of the prior day's — which was itself the highest in 52 weeks — suggesting institutions were selling into liquidity at the top of a parabolic move. The stock was also near weekly resistance.
SoundHound: a 4% ORH entry and a sell that broke the rules
Luk entered SoundHound at the opening-range high with a 4% stop — wider than he normally accepts — because he did not want to wait for the prior-day-high breakout and widen the stop further. The trade worked, but he then sold poorly: he did not follow the 9 EMA and exited on what looked like a bearish reversal, only to watch price find support at the 9 EMA and run another 80–90%. He skipped the later breakout because the general market made him skeptical, which he accepts as part of trading.
QBTS: the December trade that made 80% of the month
QBTS built a tight flag near the 9 and 21 EMAs after failing to push higher, then opened strongly. Luk bought the opening-range high but was stopped out within two or three minutes; he re-entered when the stock held and tried to break out again. He emphasizes how much difference a precise entry makes: a move that looks like less than half a bar on the chart can be 8–9% of risk. He sold most of the position into strength on accelerating volume and parabolic extension, and the trade alone contributed about 80% of his December profits.
SMTC: the loss that taught him to always set the hard stop
Luk calls his SMTC trade the best trade of 2024 because of what it taught him. He entered near the high of the day, the stock reversed within a minute or two, and he failed to set the hard stop he had planned — telling himself it would find support at premarket highs or rising five-minute EMAs. It kept falling, and he finally took a 10–12% loss around $41; the next day it gapped down another 20%. The lesson: set the stop before entry, and if the setup reverses, there will always be another entry.
A random drawdown trade with no tightness and no stop
During a summer drawdown, while interning at a bank and trading at what he calls his D-game, Luk took a random trade with no tightness and price near prior highs. He did not set or follow a hard stop, held through the reversal, and took another gap-down loss of about 10%. Looking back, he cannot explain the entry; the trade is a case study in how poor entries make everything else — stop placement, position sizing, conviction — unclear. Host and guest agree that a proper entry is the trader's best defense because it makes the failure point obvious.
Three scanners: premarket gappers, prior-day leaders, monthly leaders
Luk runs three scanners. A premarket scanner filters gappers on big volume and takes 10–15 minutes to review before the open; a potent scanner surfaces the prior day's best performers so he can see whether they cluster in one sector or theme; and a weekend leader scan ranks stocks by the past month's performance to catch names his watch list missed. When several stocks from the same theme appear in the scans, he treats it as evidence that money is flowing into that sector — the quantum stocks gapping together were one example.
Routine length and watch-list size as a market gauge
Luk spends about 30 minutes on his full scan-and-watch-list routine in a strong uptrend, and 15–20 minutes in a correction when fewer names appear. He keeps separate lists for main ideas, leading stocks, mediocre setups, lagging stocks, and mega-cap pillar names, with growth and micro-cap names in a tier-two list split by liquidity. The number of stocks migrating from the leading list to the lagging list is itself a market signal: in early December 2024, shrinking leadership made him skeptical of longs before the January drawdown.
Mega-cap pillar list and tier-two liquidity
Luk's pillar list tracks mega-caps because they drive the indexes. When Microsoft gapped down in early February and failed to reclaim its moving averages while the QQQ still looked fine, he read it as a warning that the market was not acting right and that he should not be aggressive on the long side. His tier-two list holds growth and micro-cap names, separated into stocks with more than $100 million average dollar volume and less liquid names; he prefers trading the liquid ones because illiquid small caps carry more gap-down risk.
The short setup: rejected rebounds into converging EMAs
Luk's short setup mirrors his long setup in reverse. He looks for a stock in a downtrend whose key EMAs are converging, then waits for a rebound into those declining averages to be rejected; he enters near the resistance rather than waiting for a breakdown of the prior day's low, and sets his stop near the high of the day. Because the risk is defined tightly, the trade can offer a high risk-reward even though he is not trying to catch a long-term decline. He leans toward shorts when the indexes are also near resistance and the market is in a strong downtrend.
Reddit short: levels, stops, and faster exits
Host and guest walk through a Reddit short: a leg down, a shelf, a rejection at the moving averages, and an ideal entry into the 9 EMA with the stop at the high of the day. Luk explains that he exits shorts faster than longs — mostly selling into strength rather than trailing a moving average — because he is only trying to capture a move to a logical support level such as the 150 EMA, not a home run. He had already covered near the lows and felt no regret when Reddit kept falling.
SMCI and MSTR shorts: weekly downtrends, declining EMAs
Luk's recent short examples are SMCI and MicroStrategy. He shorts when the weekly chart is in a downtrend and the key moving averages are compressed and declining; for MSTR, the declining weekly 9 EMA is the level he wants to see reject price. On the daily, he enters at prior-day-low breakdowns or opening-range lows and covers quickly, reducing short exposure when the market bounces. He is careful not to crowd too many correlated shorts at once.
Market conditions: your equity curve is the only feedback that matters
Luk argues that traders should judge market conditions primarily through their own equity curve, not through other people's opinions. He cites a tweet he likes: the one thing all traders have in common is the feedback from their own P&L, regardless of style. If the indexes are weak but his trades are working, he keeps going; if his watch list is migrating from leading to lagging, he becomes cautious. He also checks whether the indexes are approaching resistance, because breakouts often fail when the market is extended into a level.
Boom-and-bust: journaling, own rules, three weaknesses
Luk calls himself a boom-and-bust trader, not yet consistently profitable, and points to a greater-than-30% drawdown from late May to early September 2024 as the period that taught him the value of journaling. Journaling lets him reconstruct entries and exits from years ago, calculate maximum drawdown and win/loss statistics, and identify his own mistakes instead of copying other traders. He names three recurring weaknesses: revenge trading and raising risk per trade during a losing streak, not obeying stops, and trading in an unfavorable environment. He has improved the stop discipline but still catches himself revenge trading.
Cutting drawdown: January's 18% and the SURF gap-down
Reducing maximum drawdown is Luk's number-one goal, but January 2025 still delivered an 18% drawdown — better than the prior year's 30–35% but far from his target of under 15%. He was caught on both sides: bearish but stopped out of shorts, then long into weakness. A SURF Robotics position gapped down 30–40% on Nvidia-related news; he exited near the exact low, partly because he was protecting a fragile equity curve and did not want to take the loss at a better level. It reinforced why he sizes small and micro caps carefully and why gap risk is different from stop risk.
Trading as a marathon — a message to his 2050 self
Luk describes trading as a lifelong business and a marathon rather than a race for this year's P&L. He imagines his 2050 self and asks whether that future, successful trader would still make the same mistakes: overtrading, taking random entries, refusing to take a stop. The answer is no — which tells him to focus on long-term personal growth and rule-following rather than the instant impact of any single trade. He wants to be consistently profitable over ten years, not to maximize one year's return.
Getting your A-game and D-game closer together
The host introduces Jared Tendler's inchworm concept: every trader has an A-game, B-game, C-game, and D-game, and improvement means bringing those states closer together so that mistakes cost less. Luk connects it to his own experience — as a beginner, a small slip could cause a large drawdown, while an experienced trader can make a mistake without derailing the account. The goal is not perfection but a narrower gap between best and worst behavior.
Minervini's rule: lose the least, let results follow
Luk closes with a Mark Minervini quote he saved in 2022 but only fully understood after his own drawdowns: lose the least amount possible, make every decision a good risk-reward play, and the results will take care of themselves. He pairs it with the line that one day, in retrospect, the years of struggle will strike you as the most beautiful. The closing message is that process, discipline, and surviving the learning curve matter more than any single year's return; trading is hard, but not impossible.